Appearance
Reports
What it's for
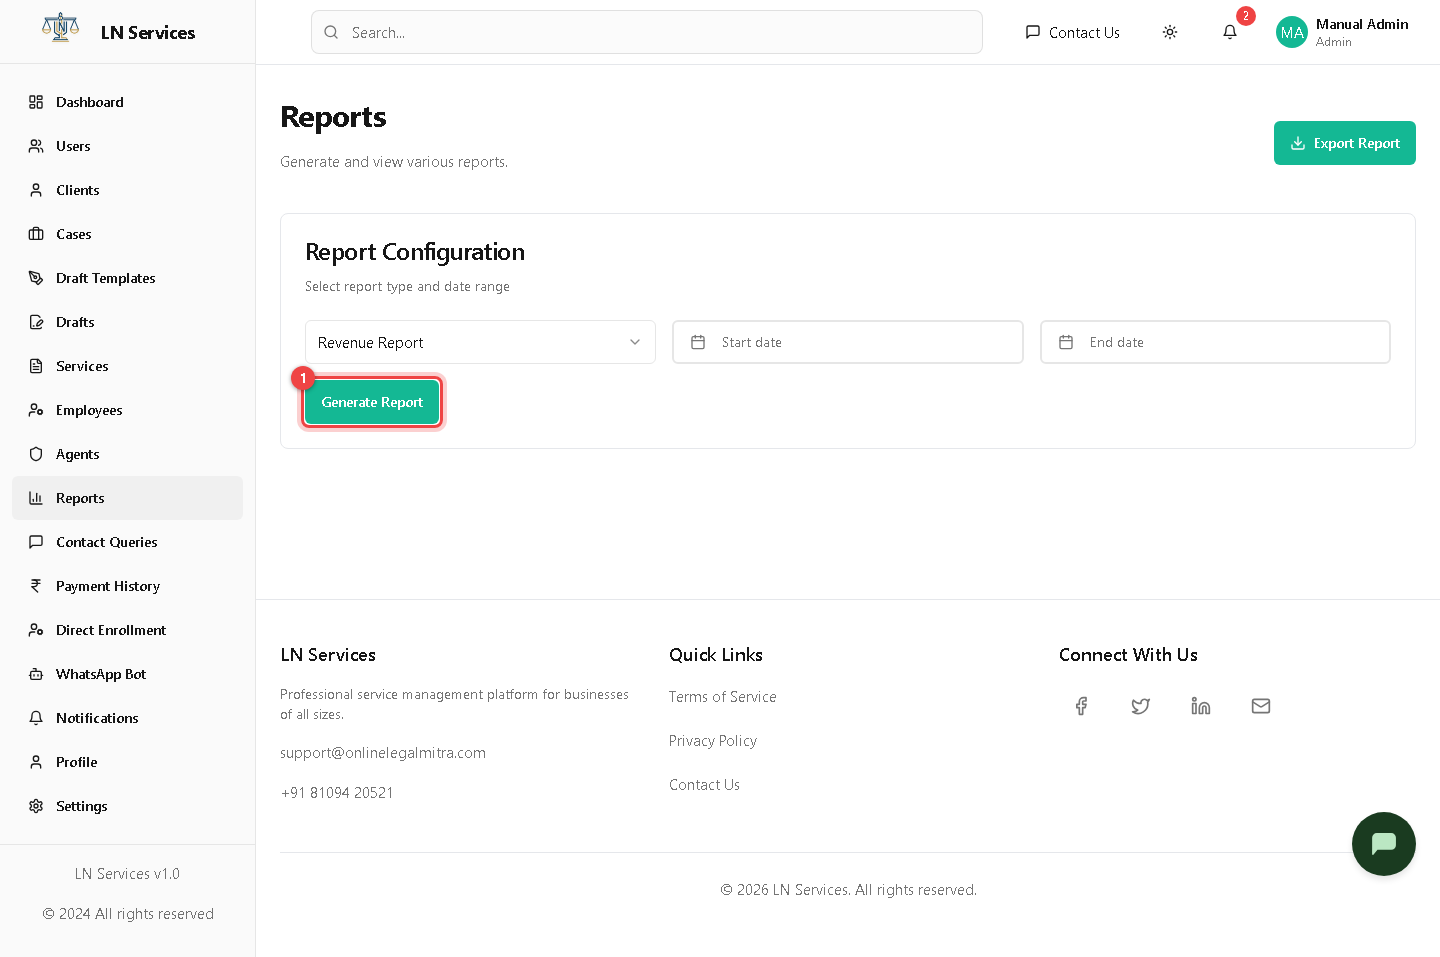
Generate a chart-based report over a date range — revenue trends, case volumes, or how agents/employees are performing.
Steps
- Pick a report type: Revenue Report, Cases Report, Agent Performance, or Employee Performance.
- Set a Start date and End date using the calendar pickers.
- Click ① Generate Report — a chart renders below using the selected range.
Technical Notes
Single endpoint: GET /api/admin/reports (report type and date range passed as query params, server returns pre-aggregated chart data). The Export Report button in the header is a placeholder — it currently only shows a "coming soon" toast, it does not actually download anything yet.